Factorial ANOVA


Two-factor
| Low N | Medium N | High N | |
|---|---|---|---|
Low temp. |
XXX |
XXX |
XXX |
High temp |
XXX |
XXX |
XXX |
\[ y_{ijk} = \mu + \alpha_i + \beta_j + \alpha_i\beta_j + \varepsilon_{ijk} \]
Two-factor
| Low N | Medium N | High N | |
|---|---|---|---|
Low temp. |
XXX |
XXX |
XXX |
High temp |
XXX |
XXX |
XXX |
 Temp   Nitrogen
------ ----------
 Low      Low
 Low      Low
 Low      Low
 Low     Medium
 Low     Medium
 Low     Medium
 Low      High
 Low      High
 Low      High
 High     Low
 High     Low
 High     Low
 High    Medium
 High    Medium
 High    Medium
 High     High
 High     High
High High Two-factor
 T     N     NA   (Intercept)   THigh   NMedium   NHigh   THigh:NMedium   THigh:NHigh
---- ------ ---- ------------- ------- --------- ------- --------------- -------------
Low   Low    NA        1          0        0        0           0              0
Low   Low    NA        1          0        0        0           0              0
Low   Low    NA        1          0        0        0           0              0
Low  Medium  NA        1          0        1        0           0              0
Low  Medium  NA        1          0        1        0           0              0
Low  Medium  NA        1          0        1        0           0              0
Low   High   NA        1          0        0        1           0              0
Low   High   NA        1          0        0        1           0              0
Low   High   NA        1          0        0        1           0              0
High  Low    NA        1          1        0        0           0              0
High  Low    NA        1          1        0        0           0              0
High  Low    NA        1          1        0        0           0              0
High Medium  NA        1          1        1        0           1              0
High Medium  NA        1          1        1        0           1              0
High Medium  NA        1          1        1        0           1              0
High  High   NA        1          1        0        1           0              1
High  High   NA        1          1        0        1           0              1
High High NA 1 1 0 1 0 1 Two-factor
| Low N | Medium N | High N | |
|---|---|---|---|
Low temp. |
XXX |
XXX |
XXX |
High temp |
XXX |
XXX |
XXX |
Two-factor
| Low N | Medium N | High N | |
|---|---|---|---|
Low temp. |
XXX |
XXX |
XXX |
High temp |
XXX |
XXX |
XXX |
\[ y_{ijk} = \mu + \alpha_i + \beta_j + \alpha_i\beta_j + \varepsilon_{ijk} \]
…
| Factor | MS | F-ratio (both fixed) | F-ratio (A fixed, B random) | F-ratio (both random) |
|---|---|---|---|---|
| A | \(MS_A\) | \(MS_A/MS_{Resid}\) | \(MS_A/MS_{A:B}\) | \(MS_A/MS_{A:B}\) |
| B | \(MS_B\) | \(MS_B/MS_{Resid}\) | \(MS_B/MS_{Resid}\) | \(MS_B/MS_{A:B}\) |
| A:B | \(MS_{A:B}\) | \(MS_{A:B}/MS_{Resid}\) | \(MS_{A:B}/MS_{Resid}\) | \(MS_{A:B}/MS_{Resid}\) |
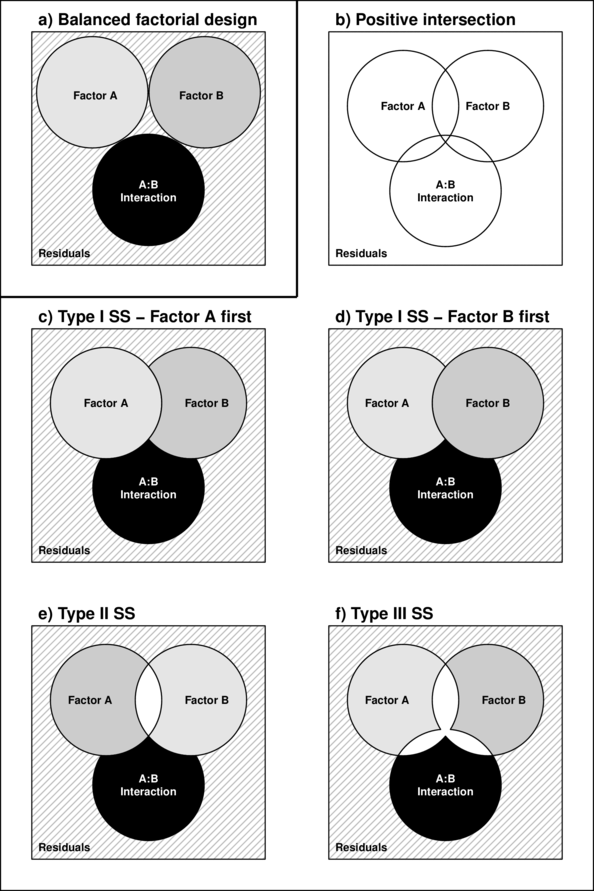
\[SS_{TOTAL} = SS_{A} + SS_{B} + SS_{A:B} + SS_{Resid}\]

\[SS_{TOTAL} = SS_{A} + SS_{B} + SS_{A:B} + SS_{Resid}\]
\[SS_{TOTAL} \ne SS_{A} + SS_{B} + SS_{A:B} + SS_{Resid}\]

\[SS_{TOTAL} = SS_{A} + SS_{B} + SS_{A:B} + SS_{Resid}\]
\[SS_{TOTAL} \ne SS_{A} + SS_{B} + SS_{A:B} + SS_{Resid}\]


| Format of starling.csv data files | |||||||||||||||||||||||||||||||||||||||||||||||||||||
|---|---|---|---|---|---|---|---|---|---|---|---|---|---|---|---|---|---|---|---|---|---|---|---|---|---|---|---|---|---|---|---|---|---|---|---|---|---|---|---|---|---|---|---|---|---|---|---|---|---|---|---|---|---|
|

|
||||||||||||||||||||||||||||||||||||||||||||||||||||
> starling <- read.csv('../data/starling.csv',strip.white=T)Error in file(file, "rt"): cannot open the connection> head(starling)Error in head(starling): object 'starling' not foundQuestion: what effects do roosting situations and season have on the mass of starlings
Linear model:| Format of stehman.csv data files | |||||||||||||||||||||||||||||||||||||||||||||||||||||
|---|---|---|---|---|---|---|---|---|---|---|---|---|---|---|---|---|---|---|---|---|---|---|---|---|---|---|---|---|---|---|---|---|---|---|---|---|---|---|---|---|---|---|---|---|---|---|---|---|---|---|---|---|---|
|

|
||||||||||||||||||||||||||||||||||||||||||||||||||||
> #Worked examples
> stehman <- read.csv('../data/stehman.csv', strip.white=T)
Error in file(file, "rt"): cannot open the connection> head(stehman)Error in head(stehman): object 'stehman' not foundQuestion: what effects do pH and health have on the bud emergence rating of spruce seedlings
Linear model:| Format of quinn.csv data files | ||||||||||||||||||||||||||||||||||||||||||||||||||||||||||||||||||
|---|---|---|---|---|---|---|---|---|---|---|---|---|---|---|---|---|---|---|---|---|---|---|---|---|---|---|---|---|---|---|---|---|---|---|---|---|---|---|---|---|---|---|---|---|---|---|---|---|---|---|---|---|---|---|---|---|---|---|---|---|---|---|---|---|---|---|
|

|
Error in file(file, "rt"): cannot open the connectionError in head(quinn): object 'quinn' not foundQuestion: what effects do season and density have on barnacle recruitment
Linear model: